
Restaurant Dashboard: Control Your Business with Real Data
From data to decision.
Track your restaurant’s performance, spot opportunities, and make smarter decisions from a single dashboard.
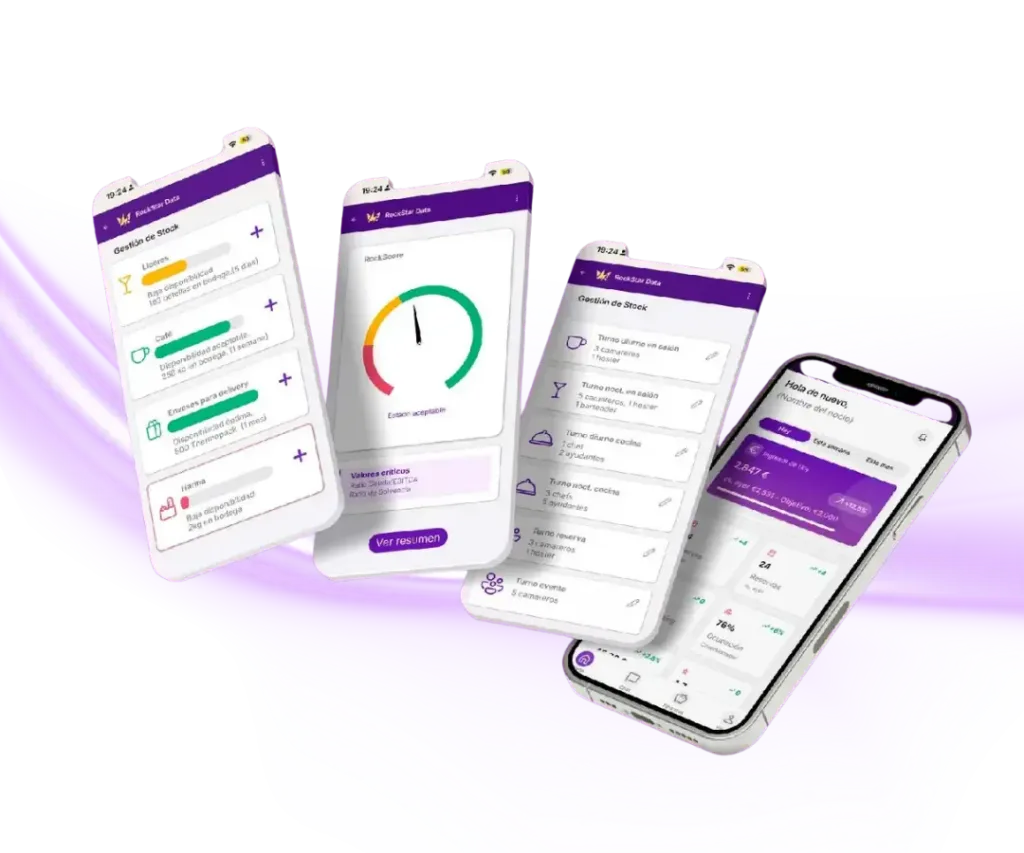
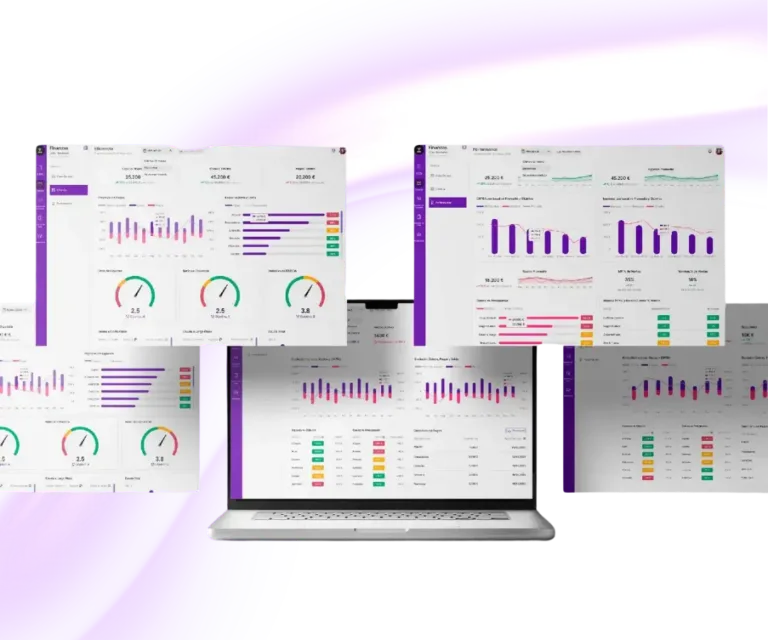
4 screens that understand how your restaurant works
- Custom KPIs for your type of business (pizzeria, fine dining, set menu…)
- Comparisons by day, week, location, and historical trend
- Automatic reorganization by time of day and context
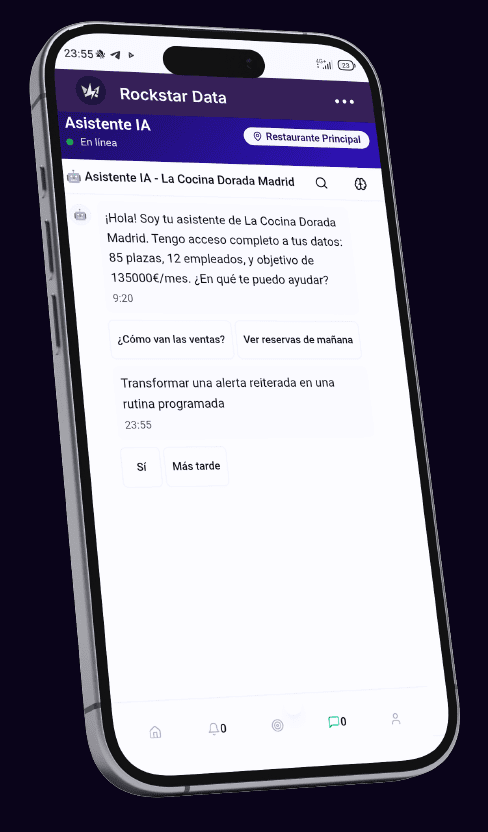
Alerts that predict, not just notify
We alert you before something happens.
- We detect anomalies in stock or average ticket
- Each alert comes with a recommendation
- Priority system: Critical > High > Medium
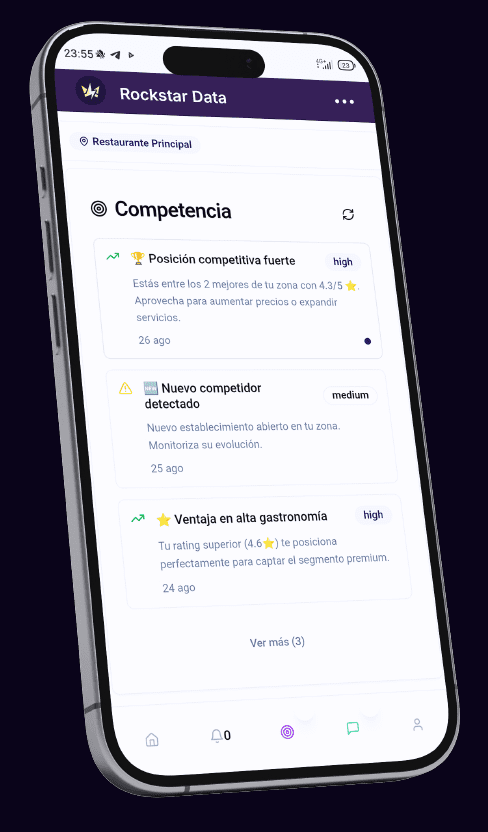
Competitive analysis
Do you know if your competitors are raising prices and you’re not?
With market data and city-by-city benchmarking, we give you exclusive insights others don’t see.
- Automatic comparisons by location and type of restaurant
- Detection of gaps in price, volume and average ticket
- Actionable suggestions for every opportunity
Intelligent onboarding
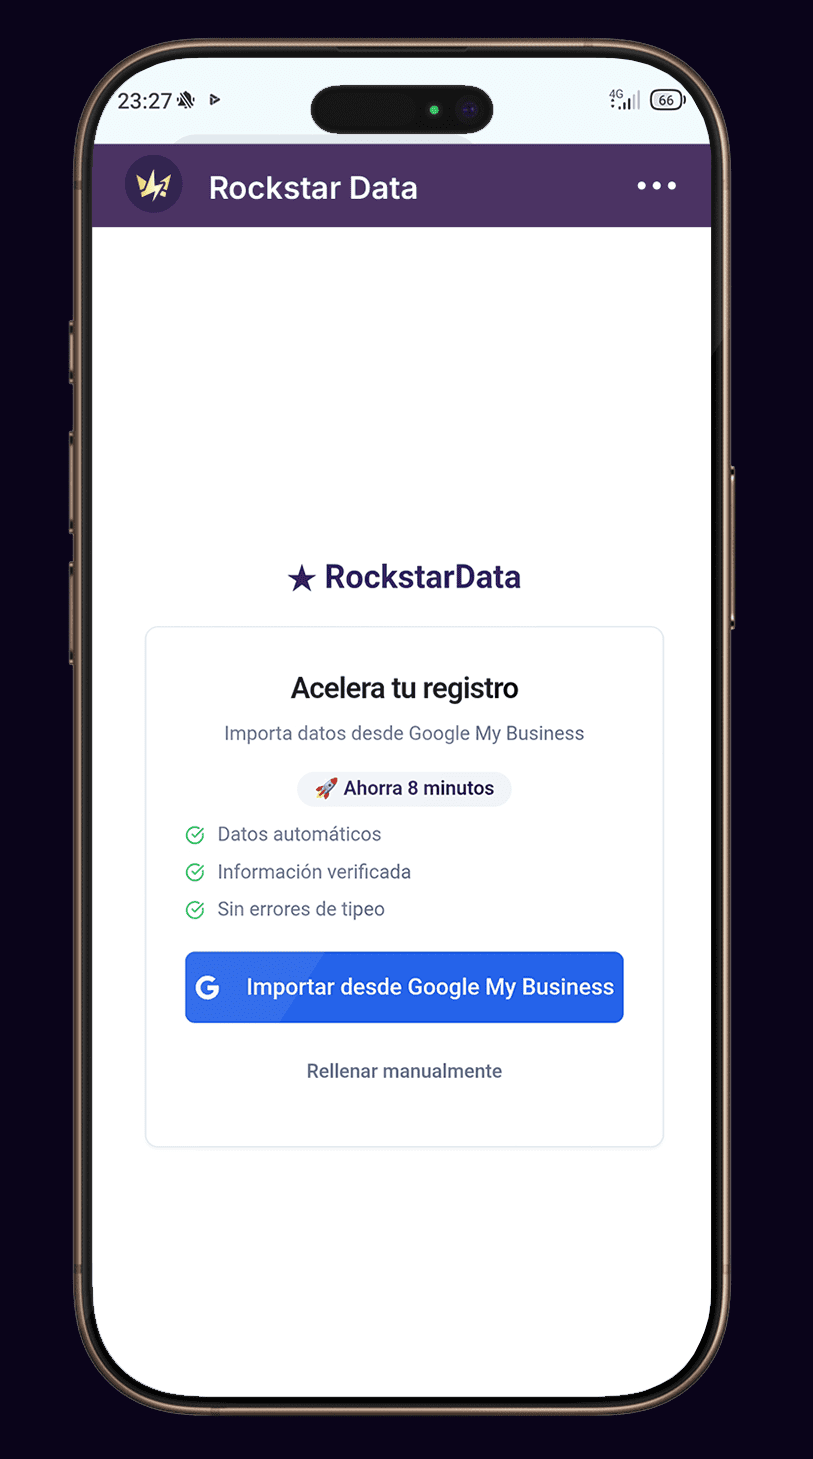
Connect your Google Business Profile and in a few minutes we’ll give you your diagnosis.
While you watch a loading screen, 200 algorithms work for you:
We detect your locations, analyze data, and estimate your revenue.
We validate opening hours, delivery, promotions, and traffic.
We create an initial proposal of objectives by channel (set menu, à la carte, delivery).
We connect the following tools
POS / TPV
Reservations software
Google Business Profile
“How did you know my average ticket was €22?”
Because we read and connect data you already have — but no one used it this way.
What makes this app unique
It’s not just a dashboard. It’s a decision-making system.
| Other solutions | Rockstar Data |
|---|---|
|
They show you graphs |
They suggest actions |
|
They need to be configured |
It works from minute one |
|
They only visualize |
They predict and prioritize |
|
They have a thousand menus |
You only see what matters |
Step by step: from setup to data collection and analysis with DAT.ai
Your intuition has taken you far. Data will take you further.
Step into the new standard of restaurant management.
Activate your Rockstar Data app now.
Everything you need to know
What is RockScore and what exactly does it measure?
RockScore is a synthetic indicator of financial and operational health designed for hospitality businesses. It doesn’t only measure sales or EBITDA, but the balance between profitability, operational efficiency, and stability. Its job is to answer one key question: is my business healthy, or is it just hanging on? By combining different signals into a single reading framework, RockScore helps you prioritize decisions and spot risks before they show up in the P&L.
How do I know if my business is financially healthy?
A healthy business isn’t the one that sells the most — it’s the one that can absorb surprises without straining. Financial health shows when margin, cash, and costs move in a coherent way. If any small deviation creates immediate stress, the business is fragile. Knowing whether a business is healthy means looking at stability, not only one-off results. Health is measured in continuity, not in peaks.
What’s the relationship between margin, cash, and EBITDA?
Margin generates EBITDA, and EBITDA supports cash — but they don’t always line up in the short term. You can have positive EBITDA and still face cash pressure if you buy poorly or pay before you collect. Analyzing these metrics in isolation leads to the wrong conclusions. Understanding how they relate helps you anticipate financial problems before they hit the bank.
Why can EBITDA mislead if it isn’t put in context?
Because EBITDA is only a partial snapshot. It doesn’t show when money comes in or goes out, or which costs are being advanced. A “good” EBITDA can hide overbuying, poorly designed promotions, or an inefficient staffing structure. Without operational context, EBITDA reassures you when it should be raising an alert. That’s why it needs to be read alongside real day-to-day data.
How do you detect invisible losses in hospitality?
Invisible losses don’t show up as a single negative line — they show up as small, constant deviations: unrecorded waste, oversized shifts, promotions that sell but leave no margin. Spotting them means comparing what should happen with what actually happens. When those gaps repeat, the business loses money without noticing.
Which indicators anticipate cash-flow problems?
Cash-flow problems can be anticipated when purchases rise without turnover, fixed costs climb, or the business depends too heavily on future revenue. Stock changes, early payments, or mismatches between sales and collections are early signals. Anyone who waits to look at the bank arrives late. Anyone who watches the trends arrives on time.
How do you compare the health of different locations in the same group?
Comparison is only useful with consistent criteria. Higher revenue does not mean healthier. Comparing health means looking at margin, efficiency, and stability — not volume alone. When a group analyzes its locations under the same framework, it quickly sees which decisions work and which don’t. Without that comparison, the group often offsets mistakes without knowing it.
Which decisions have the biggest impact on real profitability?
The decisions that matter most aren’t the big ones — they’re the repeated ones: purchasing, staff planning, and pricing. Every small daily inefficiency adds up and erodes margin. That’s why profitability is built more in day-to-day operations than in one-off actions. Identifying these key decisions improves results without adding pressure.
How do I prioritize improvements when I can’t fix everything at once?
Not everything has the same impact. Prioritizing means acting where the return is higher and the risk is lower. Purchasing and staffing usually offer the fastest adjustments. A clear reading system helps you decide what to touch first and what can wait. Prioritizing well avoids scatter and frustration.
How do you turn financial data into operational decisions?
Financial data only creates value when it turns into concrete actions: adjusting shifts, slowing purchases, changing a promotion, or reviewing prices. If a data point doesn’t lead to a decision, it’s noise. Turning data into decisions needs operational context and clarity — not complex reports. The goal isn’t to analyze more; it’s to decide better.